
Data Alone Doesn’t Drive Growth—Decisions Do.
Analytics & Attribution That Power Smarter Go-To-Market Execution

InsightLaunch helps you create sales pitch decks and outbound sequences that are clear, compelling, and built to convert—whether for a specific opportunity or your go-to-market standard.
From custom messaging by lead and role to follow-up frameworks and rep training, we help your team deliver a story that lands—and a follow-up that seals the deal.

Smarter growth starts with smarter insights.

Analytics Systems That Work—No Matter What Tools You Use
We help you unlock the full power of your existing stack—or guide you to the right one.
From web and campaign tracking to revenue attribution and reporting, we build analytics systems that fit your business, your tech, and your team’s workflow. We work with your current tools or help implement the right stack—ensuring accuracy, automation, and insight at every stage.


What’s Included with Our Service
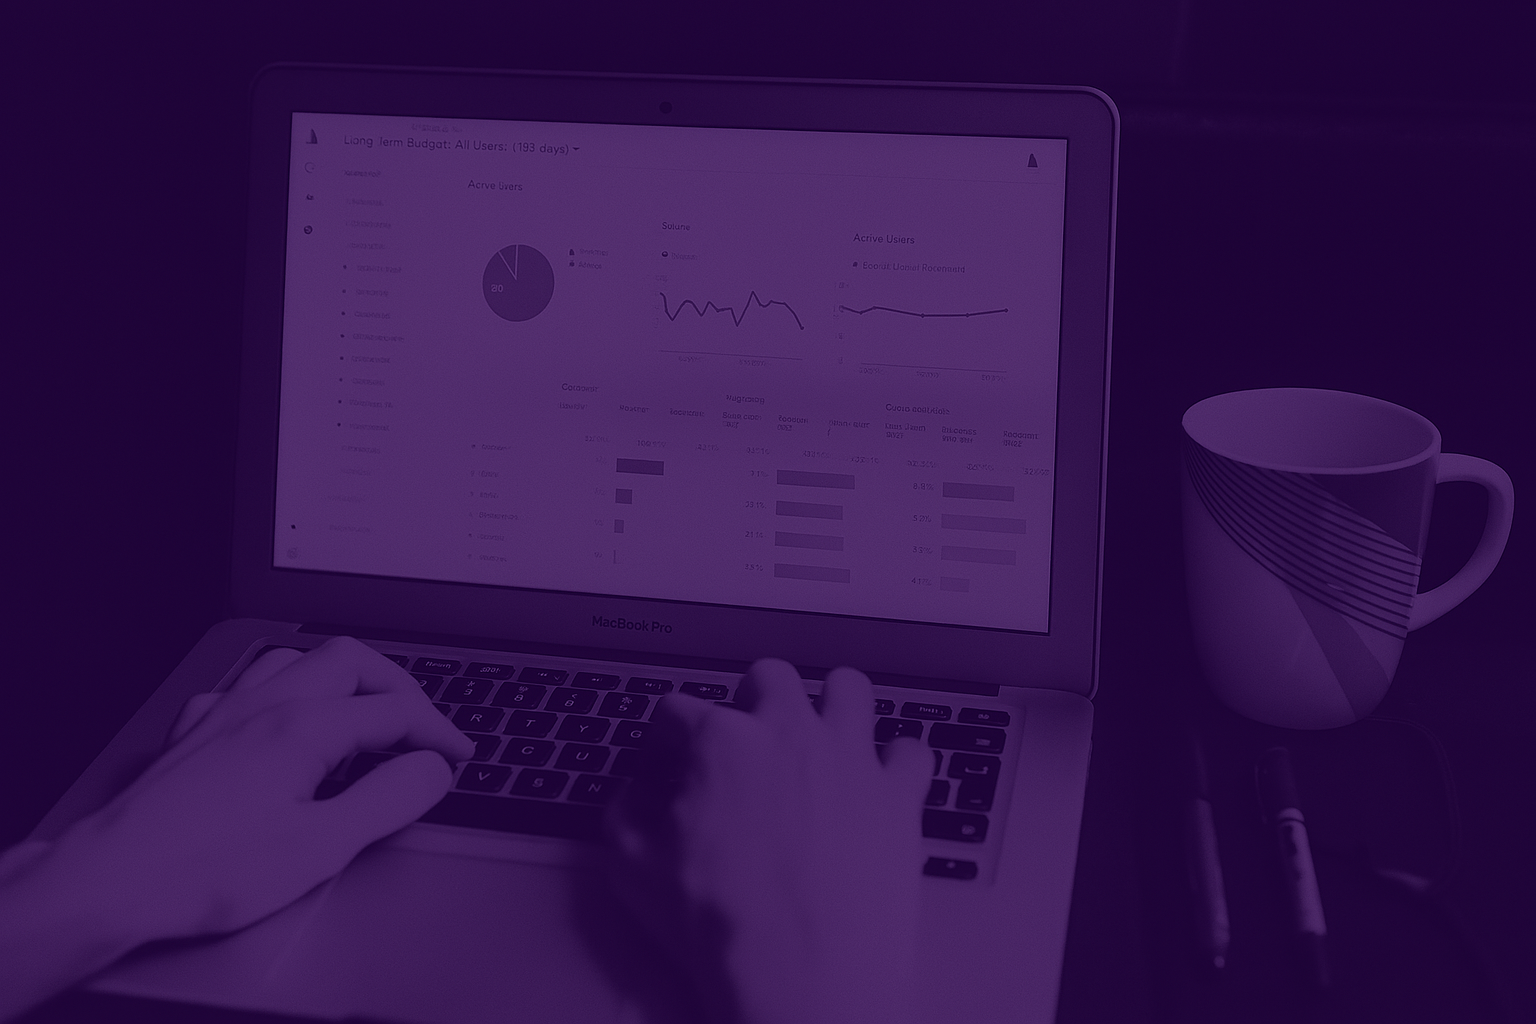
Stop Measuring Everything. Start Measuring What Matters.
Whether you’re starting from scratch or scaling existing tools, we help you build an analytics system that guides real decisions—not just reports vanity metrics.

🔧 Tool-Agnostic Strategy & Audits
We research the lead’s company, industry, and role to inform value prop selection and tone.
📉 Conversion & Performance Tracking
We run live pitch reviews, mock sessions, and feedback loops to build rep confidence and consistency.
📄 Executive Dashboards & Data Storytelling
We define the most relevant value drivers per persona—whether by role, vertical, or use case.
⚙️ AI-Powered Workflow Automation
We build multi-step email cadences based on best practices, assets, and timing aligned to your sales funnel.
📈 Attribution Modeling & Campaign ROI
We design or enhance your pitch deck—including structure, messaging hierarchy, and visual storytelling.
📚 Want help building a performance measurement system that actually guides action?
Explore our Automated Marketing Performance Services and Martech Stack Integration & Strategy Services to drive clarity and confidence across your GTM motion.
What You Say Matters. But How You Say It Wins the Deal


We Work With—and Within—Your Martech Stack
Analytics only works when it’s fully integrated.
We help you connect and configure the tools you already have—or recommend new ones that better serve your needs. Our team brings deep experience across CDPs, CRMs, CMSs, analytics tools, ad platforms, and attribution engines—ensuring you’re not just collecting data, but actually using it.
What We Help Integrate & Optimize:
Analytics: Google Analytics (GA4), Adobe Analytics, Looker Studio, Mixpanel, Heap
CRM: HubSpot, Salesforce, Marketo, Pardot, ActiveCampaign
CDP: Segment, RudderStack, Customer.io, Snowflake
Attribution platforms: Dreamdata, HockeyStack, Hyros, Northbeam
AI Platforms: AI workflow assistants & internal reporting bots
and more…
📚 Want help integrating your tech stack for accurate analytics & attribution?
Explore our Predictive Lead Scoring & Personalization Services and Martech Audit & Utilization Service to build smarter, more connected GTM systems.

A Proven Framework for Building Performance Visibility
Align your tools, teams, and goals—then scale with confidence.
We start by aligning your marketing, sales, and operations teams around shared performance goals, then build systems that make it easy to track what matters most—in the tools you already use.
How It Works:
Discovery & Tool Inventory
Assess current stack (GA4, HubSpot, Salesforce, etc.) and identify gapsGoal Alignment & KPI Planning
Collaborate across teams to define success metrics and reporting cadenceTracking Plan & Implementation
Map data flow, set up event tagging, and clean up tracking environmentsAttribution Modeling & Report Building
Define first/last/multi-touch models + create dashboards for every levelAutomation & AI Integration
Use AI to summarize trends, flag anomalies, and drive proactive decisionsTraining & Handoff
Enable your internal teams with documentation, playbooks, and prompt libraries


What an Analytics & Attribution Engagement Looks Like
Structure, speed, and strategy—tailored to your stack.
✔ Company Type: Growth-stage B2B SaaS (20+ person GTM org)
✔ Engagement Type: Analytics audit + attribution rebuild + dashboard rollout
✔ Focus Areas: Funnel tracking, GA4, Salesforce attribution, campaign ROI
✔ Internal Teams Involved: Marketing, Sales Ops, RevOps, Product Marketing
✔ Timeline: 5–7 Weeks
✔ Deliverables: Updated tracking plan, dashboard suite, attribution model guide, workflow automation, team training


Ready to Turn Data Into Decisions?
Let’s build a marketing analytics system that works—so you can grow with clarity, not chaos.